t-SNE
使用t-SNE进行二维数据投影。
输入
- 数据:输入数据集
- 数据子集:实例的子集
输出
- 选定数据:从图中选择的实例
- 数据:带有附加列的数据,显示是否选择了一个点
功能
t-SNE 小部件使用 t分布 的随机邻居嵌入方法绘制数据。 t-SNE是一种降维技术,类似于MDS,其中点通过其概率分布映射到二维空间。
界面
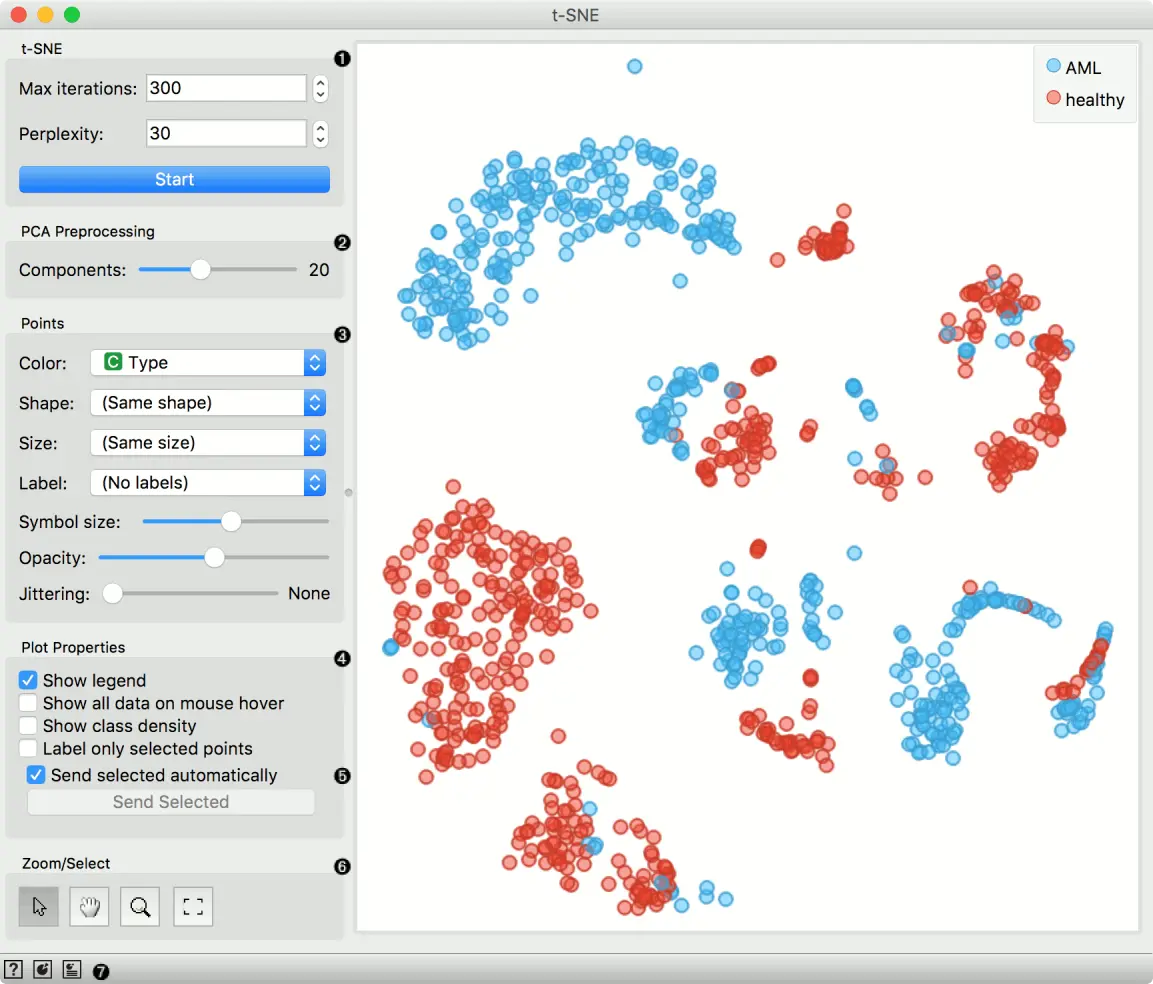
- 优化的迭代次数和困惑度的度量。按 “开始” 以(重新)运行优化。
- 选择用于投影的 PCA 成分数。
- 设置显示点的颜色(离散值将获得颜色,连续点将获得灰度点)。设置形状,大小和标签以区分点。设置所有数据点的符号大小和不透明度。设置抖动以随机分散数据点。
-
调整 图属性 等, 具体参考散点图(Scatter Plot):
- 访问帮助,保存图像或生成报告。
示例
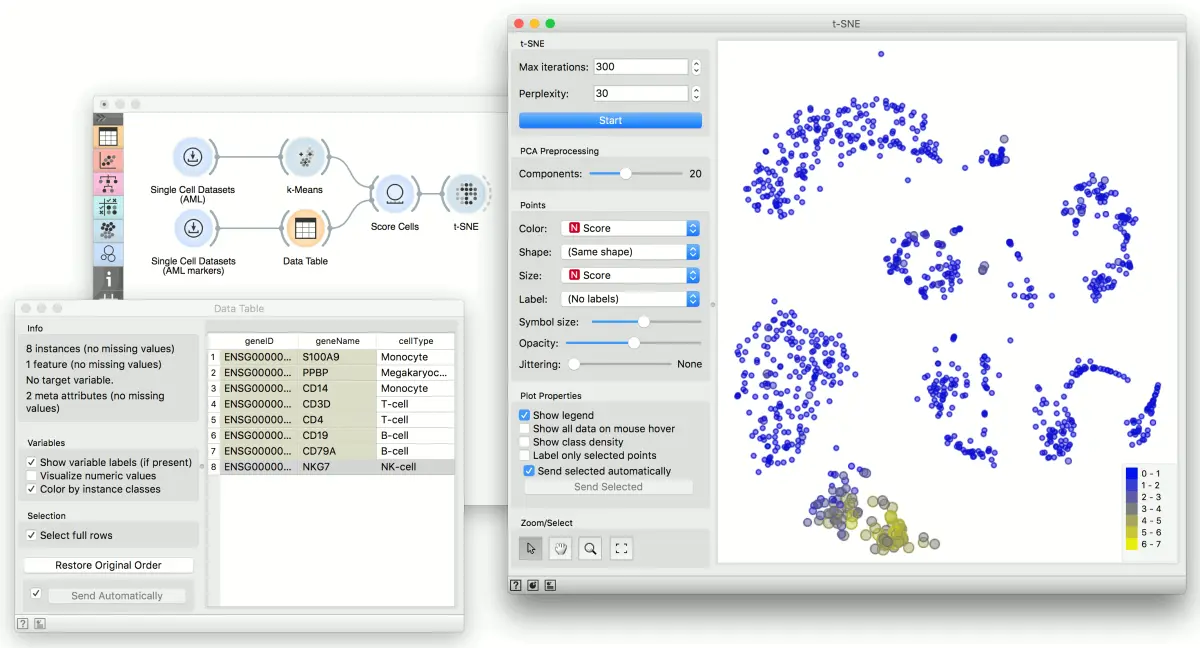
We will use Single Cell Datasets widget to load Bone marrow mononuclear cells with AML (sample) data. Then we will pass it through k-Means and select 2 clusters from Silhouette Scores. Ok, it looks like there might be two distinct clusters here.
But can we find subpopulations in these cells? Let us load Bone marrow mononuclear cells with AML (markers) with Single Cell Datasets. Now, pass the marker genes to Data Table and select, for example, natural killer cells from the list (NKG7).
Pass the markers and k-Means results to Score Cells widget and select geneName to match markers with genes. Finally, add t-SNE to visualize the results.
In t-SNE, use Scores attribute to color the points and set their size. We see that killer cells are nicely clustered together and that t-SNE indeed found subpopulations.
反馈问题
文档有问题? 或者有其他意见和建议? 请在本文档的 Github 仓库直接反馈
点我反馈进入反馈页面不知道如何反馈, 请点击这里